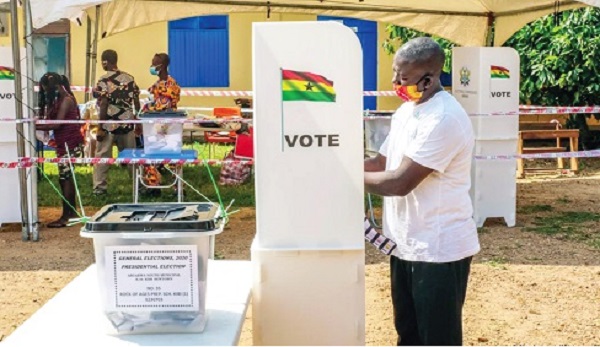
Election 2024: Who won’t vote and why?
Last week I wrote about the enthusiasm gap as we head into Election 2024. In my analysis I looked at the Afrobarometer question that asks, “If presidential elections were held tomorrow, which party’s candidate would you vote for?” and focused on those who said they would vote.
Advertisement
This week, my focus is on those who answered, “would not vote.” Recall that respondents have the following response choices – a) specifying a particular political party; or by saying b) they would not vote; c) they don’t know; or d) they can simply refuse to answer the question.
Who won’t vote?
The “would not vote” response choice was first captured in survey year 2008 (Round 4). This is the overall picture – five per cent (Round 4, 2008); seven per cent (Round 5, 2012); nine per cent (Round 6, 2014); six per cent (Round 7, 2017); 13 per cent (Round 8, 2019); and 28 per cent (Round 9, 2022).
Granted, the election is a full year away and minds can change. Additionally, the voter turnout in the most recent election (2020) was 78.89 per cent which was preceded by two survey rounds in which double percentages of respondents said they would not vote. Anything can happen between a voter saying they would not vote and what happens on election day.
However, it goes without saying that the percentage is quite astonishing for the most recent survey (Round 9, 2022).
I decided to probe the Round 9 (2022) results further. What percentage of voters within a particular demographic said they would not vote?
First, we had 32 per cent urban and 22 per cent rural; then 27 per cent male and 29 per cent female; 24 per cent with no formal education; 26 per cent with Primary school education; 29 per cent with secondary school education and 31 per cent with post-secondary education.
The results also showed that 4.29 per cent of Christians; 21 per cent Muslims and 29 per cent other faiths said they would not vote.


When it comes to the age category, 5.31 per cent of those within the 18-25 years bracket; 32 per cent of those between 26-35 years; 24 per cent within 36-45 years; 22 per cent between 46-55 years and 23 per cent within the 56+years bracket said they would not vote.
It also came out that 6.31 per cent within the Coastal belt; 30 per cent in the Middle belt and 17 per cent in the Northern belt indicated they would not vote.
In respect of membership or sympathisers of political parties, 7.3 per cent were NDC; 14 per cent were NPP while four per cent of other political parties.
The results also points to the fact that 8.23 per cent -No lived poverty; 30 per cent low lived poverty; 27 per cent - Moderate lived poverty and 28 per cent - High lived poverty)
If you look at the regional differences in descending order, this is how the picture looks like – Eastern, 42 per cent; Greater Accra, 41 per cent; Bono, 38 per cent; Central 38 per cent; Upper East, 35 per cent; North East, 28 per cent; Bono East, 28 per cent; Western, 25 per cent; Ashanti, 24 per cent; Western North, 18 per cent; Ahafo, 15 per cent; Volta, nine per cent; Northern, nine per cent; Savannah, six per cent; Upper West, three per cent and Oti three per cent.
Why won’t they vote?
Why is such a high percentage saying they would not vote? Voters are motivated by various reasons but for the purpose of this, I selected six areas of government performance to see if they are affecting the decision to vote or not to vote. They are - a) management of the economy; b) job creation; c) fighting corruption; d) addressing education needs; e) improving basic health services; and f) the president’s job performance.
Here is what the analysis showed.
Twelve per cent rate positively the government’s management of the economy; 10 per cent rate positively the government’s job creation efforts; 11 per cent rate positively the government’s fight against corruption; 31 per cent rate positively how well the government is addressing education needs, 35 per cent rate positively how well the government is improving basic health services and 19 per cent approve of the president’s job performance.
Does it mean that those who say they will vote feel differently about these areas?
1.21 per cent rate positively the government’s management of the economy.
2.19 per cent rate positively the government’s job creation efforts.
3.17 per cent rate positively the government’s fight against corruption.
4.43 per cent rate positively how well the government is addressing education needs.
5.44 per cent rate positively how well the government is improving basic health services.
6.34 per cent approve of the president’s job performance.
What next?
Two groups of voters. While there are differences between them in how they view government performance the overall disposition across both groups is not very positive. Both groups of voters are clearly dissatisfied with government performance on the key issues.
Yet, one group would vote. The other group would not vote.
If you are a political party vying for the votes of these two groups, especially those who say they would not vote, what choices do you have? Focus on those who say they would vote and win as many as you can of those voters! Craft a message that changes the minds of those saying they would not vote.
While figuring out the answer to that, here is one statistic to keep in mind because it offers a glimmer of hope if one of the strategies will be efforts to convince those who say they would not vote to change their mind. Both groups have not lost faith in using elections to choose leaders – eighty four per cent (84%) among those who say they would vote, and eighty-two per cent (82%) among those who say they would not vote.
The writer is a Democracy and Development Fellow at the Ghana Centre for Democratic Development (CDD-Ghana).