Following my last post, I am today fulfilling my promise of testing the Dramani hypothesis on WASSCE malpractice, well aware that we have just finished the New Year festivities and stand no risk of tongue slips that may enter Opera News.
Here is further news. Uncle Dramani has also threatened recalling Free SHS results, and re-marking suspect scripts if he returns to Jubilee House.
Even as you read this post, ‘suspects’ in John’s exam malpractice allegations are warming up to enter universities and other tertiary institutions; the latest news better reach them.
Having used corrupted result slips, many Free SHS graduates have left for other countries; the news better reach them. Others have landed jobs and received salaries remitted to families and relations; the Dramatic news better reach them.
Three batches of Free SHS graduates have already celebrated results and some are in medical school; the latest news better go viral.
John indeed has a lot of exam recalls and cancellations to do. That is probably the reason behind a 24-hour economy promised! He seeks to undo ‘damage’ done by rival governments, this time around the clock.
With a fountain pen in hand and sipping Eku Juice, I today walk friends and followers through the portals of history into archives under my pillow, and hobble with my walking stick to the genesis of WASSCE.
I examine various cycles of WASSCE results up to the most recent. Dramani better take a close look at the years 2011, 2012, then 2013, 2014 onwards up to 2017, and thereafter call a midnight press conference to shed Drama-thon tears.
We have an opportunity to pry beneath the eyes of the corpse 17 years after WASSCE, and examine trends in candidate performance as well as the credibility of WASSCE results triggered by the various educational policies impacting the high school education portfolio. Don’t mind any slimy maggots this perilous venture may scoop.
We summarize the background of the various educational policies through which the exam has traversed since 2006, spotlighting result trends in the core courses at WASSCE: maths, and integrated science (and later English and social studies) based on raw data from WAEC and MoE.
In seeking to summarize WASSCE results from its genesis to date, I draw attention to four major developments in Ghana’s educational policy over the years impacting exam outcomes.
- The 3year SHS policy that pre-existed when WASSCE started in 2006. That policy was part of the Rawlings legacy when Kufuor assumed the reins of governance in 2000.
- John Kufuor, having started background work through an Anamoah Mensah Committee in 2002 eventually launched a 4year SHS policy in 2007. This was before 2009 when J.E.A. Mills/Mahama took over. Students under Kufuor’s 4year policy did WASSCE 2011, 2012, and 2013.
- Mills/Mahama 3year SHS policy replaced Kufuor’s; and its outcomes are evident in at least four WASSCEs: 2013, 2014, 2015, 2016, partly overlapping the Free SHS policy from 2017 onwards.
- Nana Akufo-Addo’s Free SHS policy introduced in 2017, essentially retained Mills’ 3year policy, but eclipsed it with a game-changing bouquet of freebies: free boarding, lodging, tuition and a related bundle of giveaways. The Nana Addo package produced candidates who took WASSCE from 2020 to 2023. The results of 2023 WASSCE are currently in the public domain.
Note two irregular developments along the way.
First from 2006 when WASSCE took over from SSCE (Senior Secondary Certificate Exams) to 2023, the total number of WASSCE taken has been 17.
The full count, however, should be 18, except that there was no WASSCE in 2010 because the 4year group were in Year 3, and the 3year group were barely starting their cycle.
Secondly in the year 2013, students of the two rival policies clashed, sitting and writing the same WASSCE.
It was the last phase for the 4year cohort, while the 3year group would continue. This was indeed part of the disorderly outcomes triggered by the policy shift.
In this report, there are altogether four charts.
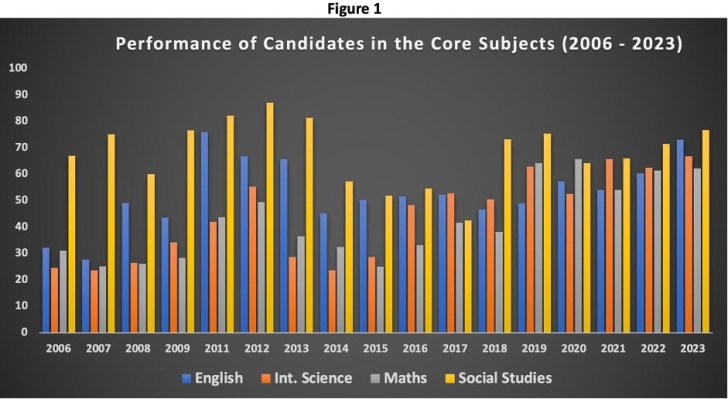
Figure One is a composite, which at a glance displays percentage scores for each of the 4 core courses: English, maths, integrated science, social studies, from 2006 to 2023.
Figure 2, a simpler chart, displays trends in average credit passes for the 17 WASSCE exams held.
Figures 3, 4, (and later 5, 6) are disaggregated trends in each core course: maths, and integrated science, (later English, and social studies) covering all 17 exams.
This post presents a truncated version which postpones discussion of English and social studies till a subsequent post.
Figure 1. Immediately following is a composite master chart representing the entire picture involving the respective percentage scores for each of the four core courses from the beginning of WASSCE from 2006 to 2023.
Figure 1 (Composite Chart)
Out of this composite representation, one can abstract yearly averages in a simplified chart as in Figure 2.
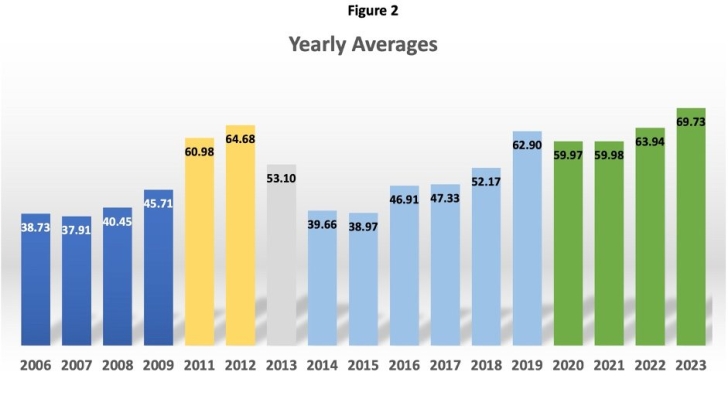
Figure 2 (Yearly Averages)
Using the average scores for each year, note the spread of years from 2006 to 2023 with the year 2010 omitted.
The period 2006 to 2009 registers scores ranging from averages of 39% in 2006 to 46% in 2009. This however leaps to 61% in 2011 and 65% in 2012, then drops slightly to 53% and further down. The first surge from 46 to 61, an increase of 15 percentage points, marks a major shift in trends and requires explanation.
Whereas a 3year SHS policy inherited by the Kufuor Government was responsible for the WASSCE 2006 to 2009, the years 2011, 2012, 2013 were outcomes of WASSCE taken by students of Kufuor’s 4year policy who took 3 consecutive WASSCEs.
In 2013, the percentage score drops by 12 percentage points to 53.
This is because the two rival groups took the same exam, one section being products of the 3year policy and the other, candidates of the longer 4year regime.
A combination of the two parallel scores produces an average which is 12 percentage points lower than the 2012 figure of 65.
The period 2014 to 2019 is a continuation of the 3year policy, but shows uneven outcomes. Whereas 2014 and 2015 show similar outcomes, the period 2016 to 2018 sees a jump close to 5 percentage points, and eventually registers in 2019 a high score of 63.
This score comes within the ‘golden’ range registered by the 4year group in 2011/2012. The zone from 2017 onwards marks a major policy intervention, the Free SHS policy of Nana Akufo Addo.
Under normal circumstances one would be solely interested in WASSCEs from 2020 onwards, taken by candidates under the Free SHS policy. The scope and ingredients of the policy initiatives, however, compel a good look at their collateral impact on preceding years.
In 2017, when the Free SHS started, it came with a raft of benefits that did not exclusively target new students. In addition to free tuition, boarding, and other freebies, it also introduced related policy initiatives which benefitted all students including pre-Free SHS students already at school. I hinted this in a speech I gave at the 2019 WAEC Excellence awards in my capacity as minister of state at the Ministry of Education. Hear my words:
“Even as we all await WASSCE 2020 to assess the Free SHS policy, WASSCE 2019 should present a foretaste of possible outcomes since some of the interventions rolled out by Government, were not targeted exclusively at beneficiaries of Free SHS, but had implications for all students at SHS, whether or not these are direct beneficiaries of a fully-fledged Free SHS policy.
Students who wrote the 2019 WASSCE were in Year Two when the Free SHS policy started, and may have missed the full menu, but not its ancillary benefits.”
The same speech could have applied to 2018 WASSCE also. It is however from 2020 to 2023 WASSCE that the full impact of the Free SHS policy is felt. These are results of 4 batches of Free SHS students: 2017, 2018, 2019, and 2020, and had been foreshadowed two years earlier.
The impressive WASSCE scores from 2020 to 2023 ranging from 60 to 70 percent, along with a 2023 score of 70% which towers above all previous scores, may be directly traced to the Free SHS policy.
The policy came with allied initiatives of expanded contact hours, change from trimester to a semester system, bonus to teachers for extra classes; adjustment of academic and exam calendar to improve contact hours, etc.
The impact of WASSCE results through to the Free SHS policy, is more clearly seen in disaggregated outcomes from individual core courses across the years, particularly maths and integrated science.
These two courses are being highlighted due to their implications for Ghana’s future in the areas of science and technology.
Figure 3 (Maths)
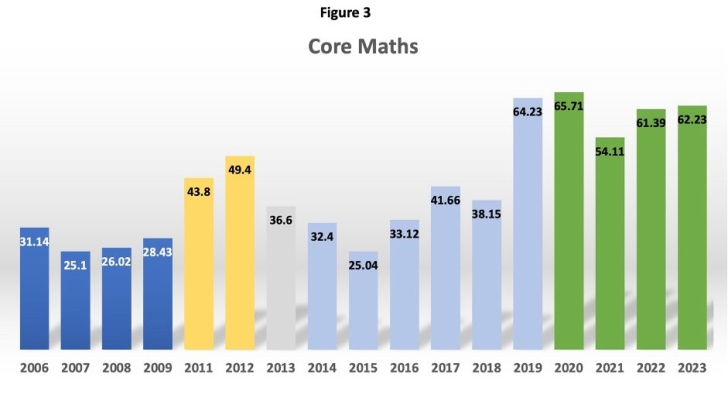
Maths begins WASSCE in 2006 on a very pessimistic footing, registering low averages in the first four years ranging from 25% to 31%. There is however a sharp surge in 2011 to 44%, and an increase of 16 percentage points, spiking further to 49% in 2012, but dipping to the 30s in 2013 and beyond.
The first major ascent signals the onset of the 4year project from 2011, lifting the gloom from the 3year policy whose outcomes started WASSCE with fail grades.
The 2013 figure of 37% is a dip by 12 percentage points from 2012, but hovers above the low maths grades that started WASSCE. 2013 marks a blend of the two rival policies, and registers an average of 37%, which dips in subsequent years when the exam is taken solely by the 3yr group.
The 25% scored in 2015 is the weakest maths grade in the history of WASSCE, but the trend quickly changes and registers a turnaround in 2017 hitting lofty trends from 2019 to 2023, with a winsome average of 61.5%.
Significantly the 62% scored in 2023 is lower than the 2019 grade of 64% obtained ahead of 2020, the official debut of Free SHS results.
This is a clear demonstration of early warning signals from Free SHS, that give a foretaste of the formal take off. The official Free SHS grades from 2020 were thus not a sudden disruption; they followed previous rising trends triggered by the new policy in 2017.
Figure 4 (Science)
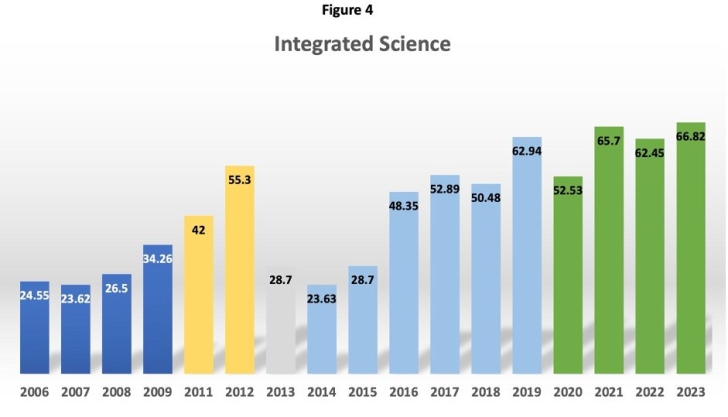
The trend is similar with integrated science, which started WASSCE with fail grades averaging 27% from 2006-9. The surge to 42 and 55 with the start of the 4year program was not surprising.
Like the trend in maths, the 4year golden spark was compromised in 2013 with a blend of competing policies, which sent grades plummeting to the 20s in 2014 and 2015.
The 29% science grade in 2015 was significantly low; but there was a quick turnaround by 68% the following year, 2016. The 48% score in 2016 sparked a lofty trend that never looked back.
The 2023 score of 67% is so far WASSCE’s highest in science, and supports the 62% average registered from 2019 to 2023.
Significantly two science grades registered before 2020 in 2017 and 2019 are higher than the 2020 grade; the 2019 grade is also higher than grades in 2020 and 2022.
These indicate a general upward swing triggered in 2017 by the Free SHS and blending with subsequent grades.
The impression of a sudden upswing of fortunes in 2020 WASSCE and beyond does not stand scrutiny. The outcome of the Free SHS package blends neatly with prevailing result trends ahead of the formal debut of SHS outcomes; and was not an overnight flash in the pan.
Secondly the abysmal performance at WASSCE by the 3yr SHS students under the Mills/Mahama policy, should provide Uncle Dramani greater food for thought, than the improved results of underprivileged students.
Friends and followers, please allow the senior citizen to take a rest, after this marathon attempt to pry beneath the eyes of the corpse. I continue in my next post examining WASSCE trends in English and social studies and giving a few dramatic lessons on exam cancellations.
Please check the levels of my Eku Juice.